
23 May, 2017
KAUST IT rolls out Research GIS support facility, with the Integrated Ocean Processes group pioneering GIS research applications for the Red Sea.
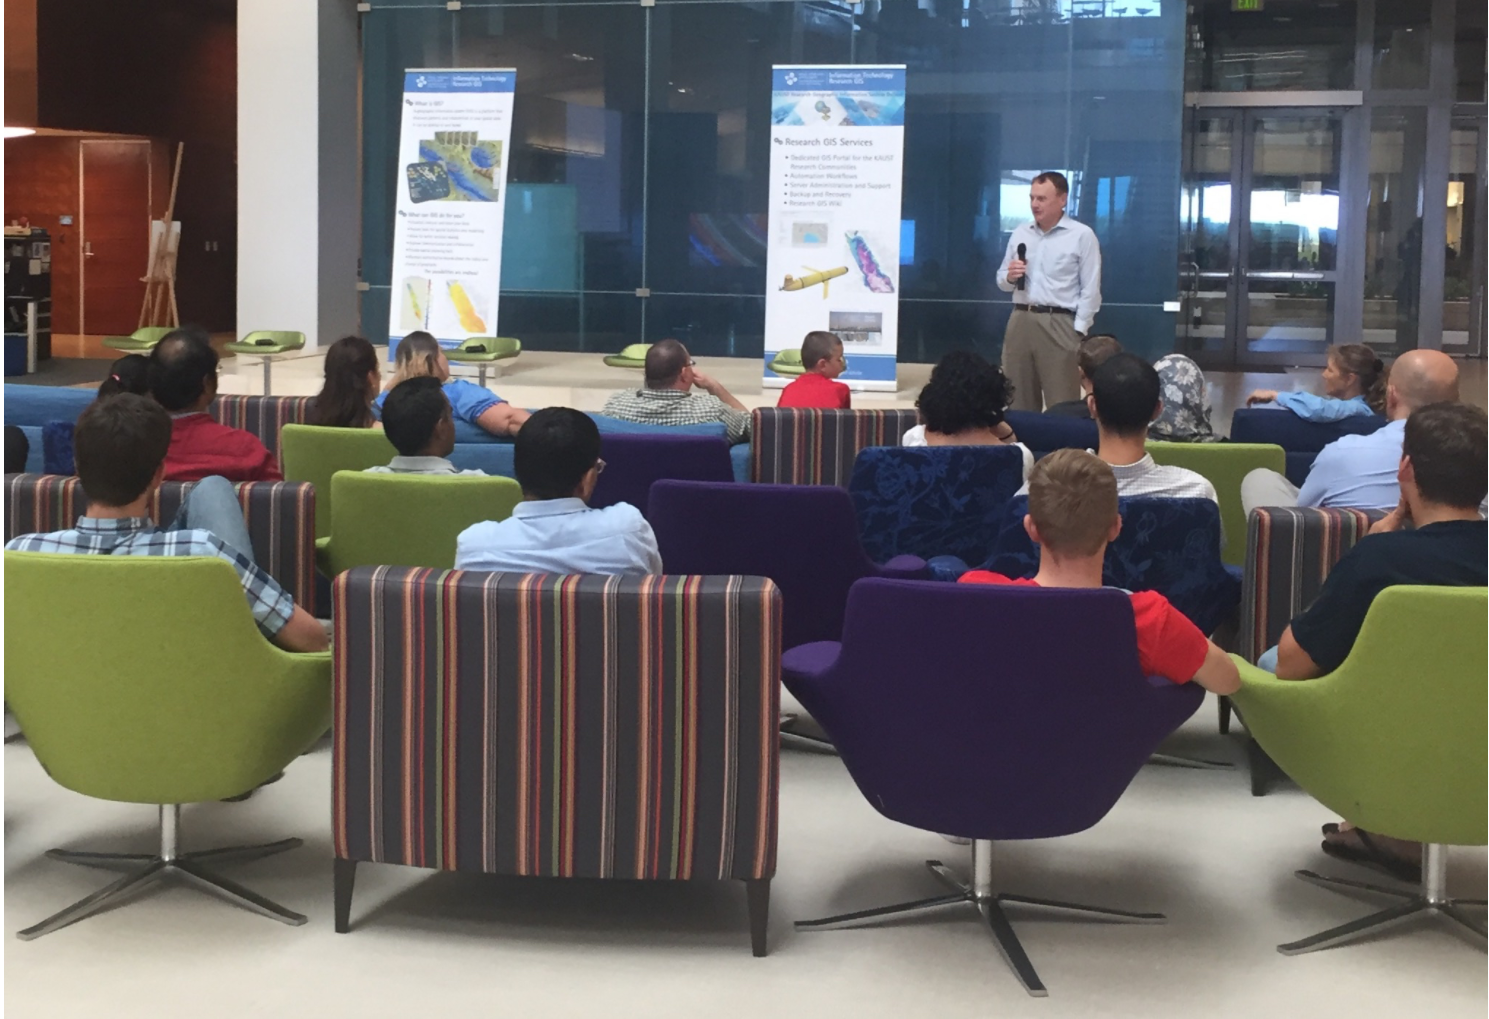
Professor Burt Jones was lead speaker for the roll-out of the KAUST IT Geographic Information System services on 23 May 2017. The Integrated Ocean Processes Group is the pioneering user group, establishing the research GIS platform available to faculty, research scientists, post-docs, students throughout KAUST.
A Geographic Information System is a software tool that discovers patterns and relationships in your spatial data. It helps you to visualize, analyze and share your data. It can also help in better decision-making and improved communication and collaboration with stakeholders.
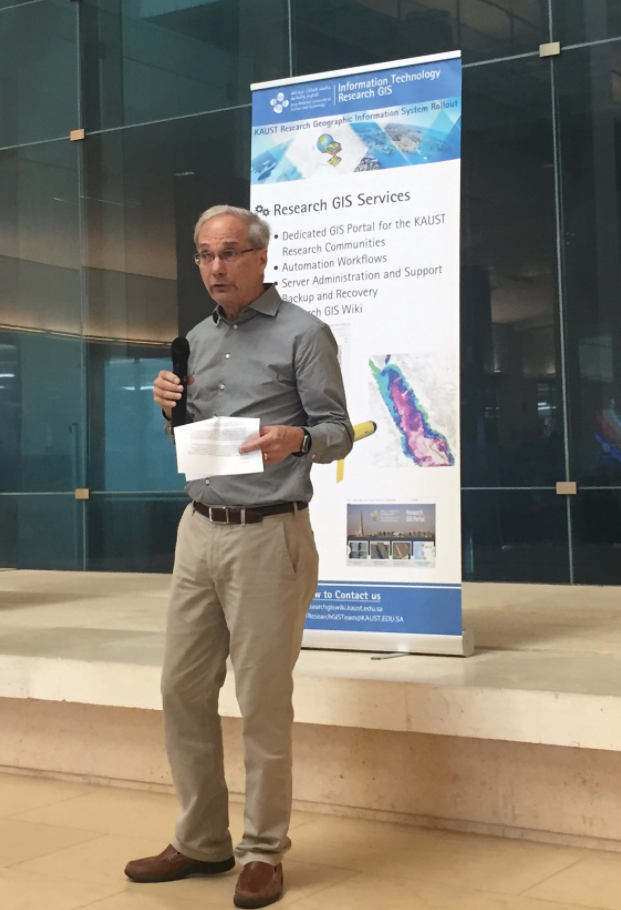
John Larson, KAUST IT's Chief Information Officer (below) explains to event participants that KAUST's GIS system was originally provided by Saudi Aramco. While the original intention of the GIS system for KAUST was to map facility and campus features, software licenses are freely available for educational and research purposes. KAUST IT Department, in partnership with GIS Specialist Ute Langner and software engineer Sebastian Steinke in the IOP group, transformed the application of GIS at KAUST into a platform available to all researchers interested in sharing, analyzing and visualizing their spatially-based research.
The Saudi Aramco-KAUST center for Marine Enviromental Observations (SAKMEO), hosted at KAUST, developed the Red Sea Database and a marine GIS capability to provide a mechanism for mapping, analysis and management based on the various datasets acquired by SAKMEO and increasingly by the Red Sea Research Center at KAUST . As the first major GIS research initiative within KAUST, this investment will provide research dividends to the RSRC and be available to the wider KAUST and external research community. The GIS capability links directly with the Red Sea Database to provide tools for visualization and comparison of datasets.
For example, below Ute demonstrates how GIS can visualize glider movements and data off of Yanbu, Saudi Arabia in 2017. The seagliders provide continuous, long-term monitoring of oceanographic parameters of the Red Sea. GIS enables us to visualize, analyze and understand the functioning of the Red Sea as never before.
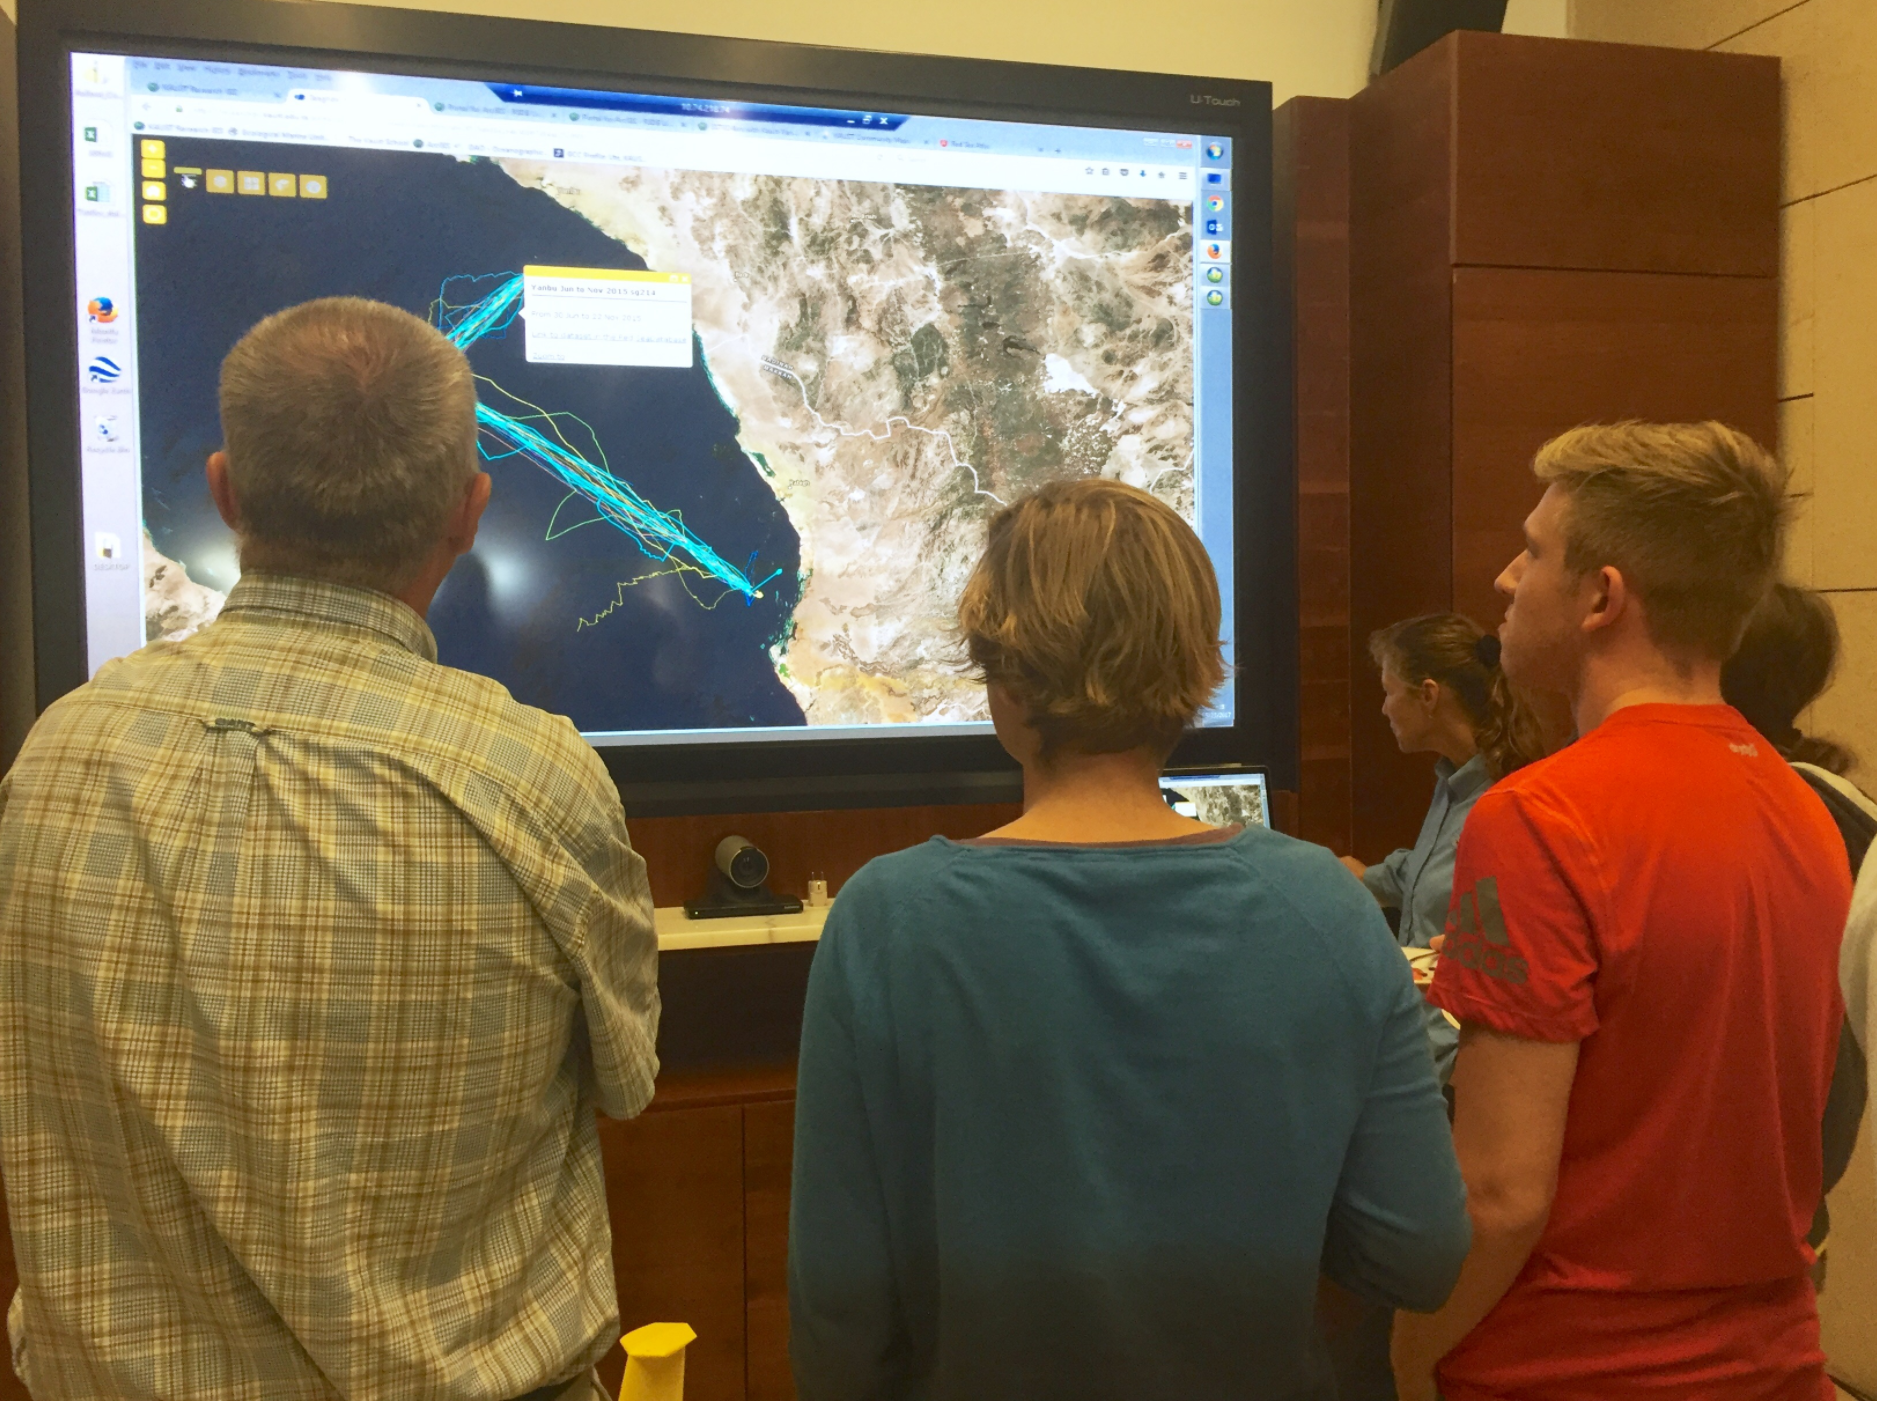
The GIS capability at KAUST is a key component of the first ocean observatory for the Red Sea.